Latest Economic Data Tracks Arts and Cultural Jobs per State
Bureau of Economic Analysis & National Endowment for the Arts Release Research
By Victoria Hutter, Assistant Director, Press | Public Affairs, National Endowment for the Arts –
- For the first time, state leaders will have authoritative federal data on arts and cultural employment and compensation in their state with the announcement of the latest findings from the Arts and Cultural Production Satellite Account (ACPSA). A collaboration of the National Endowment for the Arts and the U.S. Department of Commerce’s Bureau of Economic Analysis (BEA), the ACPSA is the first federal effort to provide in-depth analysis of the arts and cultural sector’s contributions to the U.S. economy.This latest ACPSA data is from 2014 and reveals that the arts and cultural sector contributed $729.6 billion or 4.2 percent to the U.S. economy that year. Between 1998 and 2014, the contribution of arts and culture to the nation’s gross domestic product grew by 35.1 percent. The new state data tracking arts and cultural employment and compensation provides illuminating profiles and allows for comparisons among states and regions.
“Information from the Arts and Cultural Production Satellite Account has been invaluable for understanding the role of arts and culture in our economy, demonstrating that the arts are indeed part of our everyday lives,” said NEA Chairman Jane Chu. “Now with the new state data, state leaders have a powerful tool to assess and advance arts and culture for the benefit of all their residents.”
The ACPSA identifies and measures 35 industries that constitute the larger arts and cultural sector. The employment and compensation totals for these industries are represented as national and state-level numbers with the latter relative to the national rate. The relationship of the state numbers to the U.S. average is expressed in the form of percentages and location quotients (LQ), which account for the state’s overall workforce.
Highlights and resources
State profiles
- The Bureau of Economic Analysis’s state fact sheets feature ACPSA employment, compensation, top industries, trends, and rankings for 50 states and the District of Columbia.
- Through an award from the NEA, the National Assembly of State Arts Agencies produced an interactive dashboard that goes into greater depth with the ACPSA data, allowing users to explore key information for individual states.
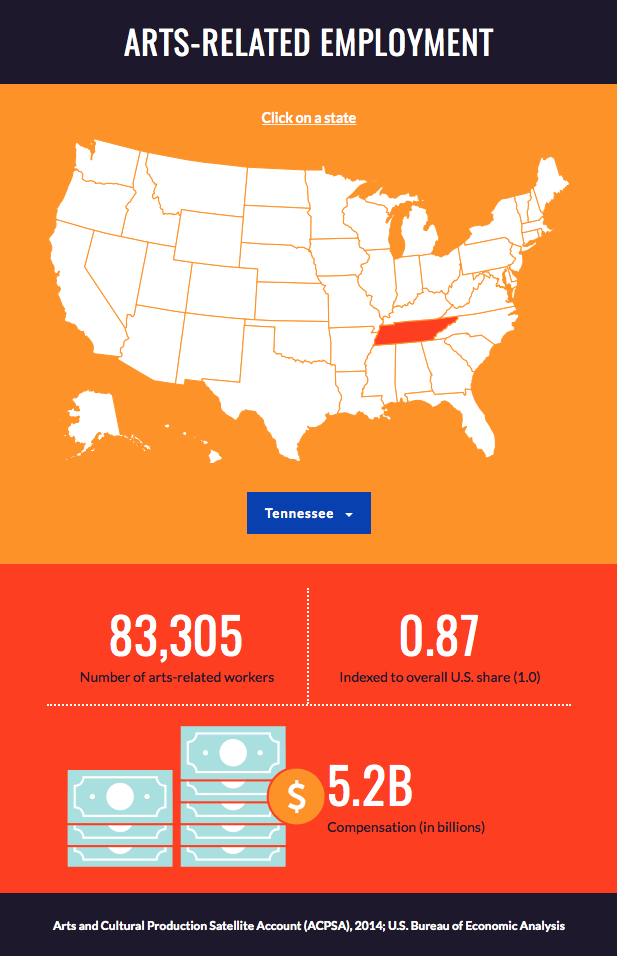
- An interactive infographic offers a quick look at states’ arts and cultural employment and compensation.
Overall state comparisons, 2014
- New York, Washington, and Wyoming exceed the national index by 28 to 47 percent for arts and cultural workers on a per worker basis.
- Wyoming has high numbers in arts and culture-related construction and government, which includes nature parks.
- Seven states— Alaska, California, Colorado, Massachusetts, Oregon, Rhode Island, and Utah—exceed the national rate for arts and cultural workers by nine to 17 percent.
- Utah has high numbers in jewelry manufacturing, design services, and performing arts presenters.
- Resources for exploring state comparisons in addition to state profiles:
Industry comparisons by state, 2014
- For performing arts employment per worker, the top five states include Hawaii, Nevada, and Rhode Island. Nevada’s compensation for these workers is four times the national index.
- Hawaii’s 23 museums and 17 zoos and botanical gardens contribute to the state’s high museum employment, which is four times the national rate.
- In the motion picture and video industry, the top five states for employment per worker include Louisiana, New Mexico, and Utah, with Louisiana ranking the highest after California and New York.
- For sound recording (as a share of state employment and compensation for all industries), Tennessee is the leader at six to seven times the national index. Indiana ranks high in musical instrument production, at 2.3 times the national rate.
- Resources for exploring industry comparisons
- Research Brief : State Highlights of Arts and Cultural Employment and Compensation, 2014
- An interactive infographic shows selected industry totals included in the ACPSA sector
State trends
- Between 2013 and 2014, the growth in arts and cultural workers exceeded the national rate in 17 states, with the largest growth in Arizona, Nevada, Utah, and Washington.
- Utah and Washington gained arts and cultural workers in both the short term (2013-2014) and the longer term (2008-2014).
- Since the recession (2008-2014), few states experienced gains in arts and cultural workers, however, a significant exception is North Dakota, where growth was at 11 percent, reflecting the state’s total employment increase of 26 percent.
- Between 2013 and 2014, arts and cultural employment fell by one percent or more in only 12 states.
- In Montana, a decrease in arts-related retail sales and construction were the main sources of declining arts and cultural employment. In West Virginia, reduced employment in government impacted arts and cultural employment.
- Resources for exploring state trends
ACPSA resources for researchers
To help researchers delve into the numbers, the NEA offers two arts data profiles: Arts Data Profile #12: The U.S. Arts and Cultural Production Satellite Account (1998-2014) Arts Data Profile #13: State-Level Estimates of Arts and Cultural Employment (2001-2014) that features many of the above resources in addition to satellite account tables and the NEA Guide to the U.S. Arts and Cultural Production Satellite Account.
About the NEA Office of Research & Analysis
As the federal agency of record on arts research, the NEA, through its Office of Research & Analysis, produces accurate, relevant, and timely analyses and reports that reveal the conditions and characteristics of the U.S. arts ecosystem and the impact of the arts on our everyday lives. The latest ACPSA findings add an important resource to the agency’s collection of publications such as, A Decade of Arts Engagement: Findings From the Survey of Public Participation in the Arts, 2002–2012, funding opportunities such as Research: Art Works, leading the Federal Agency Taskforce on Human Development, and producing other data resources.
ultural employment. In West Virginia, reduced employment in government impacted arts and cultural employment.
- Resources for exploring state trends
- Research Brief #2: Trends in Arts and Cultural Employment
ACPSA resources for researchers
To help researchers delve into the numbers, the NEA offers an Arts Data Profile that features many of the above resources in addition to satellite account tables and the NEA Guide to the U.S. Arts and Cultural Production Satellite Account.
About the NEA Office of Research & Analysis
As the federal agency of record on arts research, the NEA, through its Office of Research & Analysis, produces accurate, relevant, and timely analyses and reports that reveal the conditions and characteristics of the U.S. arts ecosystem and the impact of the arts on our everyday lives. The latest ACPSA findings add an important resource to the agency’s collection of publications such as, A Decade of Arts Engagement: Findings From the Survey of Public Participation in the Arts, 2002–2012, funding opportunities such as Research: Art Works, leading the Federal Agency Taskforce on Human Development, and producing other data resources.